
Oil Prices and the Business Cycle

Photo by Maksym Kaharlytskyi on Unsplash
Oil occupies a unique position among commodities: it is simultaneously a commodity with its own supply and demand dynamics and a macroeconomic variable that influences the entire economy. The historical record of the relationship between oil prices and recessions is striking.
Economist James Hamilton first systematically documented this relationship in a landmark 1983 paper ("Oil and the Macroeconomy Since World War II", Journal of Political Economy), finding that virtually every US recession since World War II had been preceded by a significant rise in oil prices. He updated and extended this analysis in a 2009 paper ("Causes and Consequences of the Oil Shock of 2007–08"), exploring the mechanisms by which oil shocks transmit into broader economic slowdown: higher transport costs, reduced consumer discretionary spending as fuel costs rise, uncertainty-driven investment freezes, and policy responses (interest rate rises to fight inflation) that compound the original shock.
The channel is intuitive: oil is an input to nearly every economic activity. When oil prices rise sharply, they act as a tax on the whole economy — reducing disposable income for consumers, raising costs for producers, and often triggering inflation that forces central banks to raise interest rates. The combination of supply shock and monetary tightening can push economies into recession.
The Petrodollar System

Photo by Shaah Shahidh on Unsplash
One of the most important structural features of the global commodity market is that oil is priced in US dollars. This convention, formalised after the 1973 oil crisis through agreements between the US and Saudi Arabia, means that every country in the world that imports oil must first acquire US dollars to pay for it. This creates structural, persistent global demand for US dollars — the petrodollar system.
The petrodollar system reinforces the US dollar's status as the world's reserve currency. Countries that export oil accumulate large dollar surpluses (petrodollars), which they then recycle into US Treasury bonds and other dollar-denominated assets — supporting US bond prices and keeping US borrowing costs lower than they might otherwise be.
Any shift away from dollar pricing for oil — whether toward the euro, yuan, or a basket currency — would reduce structural dollar demand and could have significant implications for US interest rates and financial conditions. This geopolitical dimension of oil pricing gives the dollar-oil relationship a significance beyond simple commodity economics.
Natural Gas and Industrial Competitiveness

Natural gas is not merely an energy source — it is a fundamental input to industrial production. It powers petrochemical plants, fertiliser factories, steel furnaces, glass manufacturers, and ceramics producers. When gas prices are low, energy-intensive industries enjoy a cost advantage; when they are high, those same industries face an existential competitive challenge.
The 2022 European gas crisis — triggered by the curtailment of Russian gas flows following the invasion of Ukraine — provided a live demonstration of this dynamic. TTF natural gas prices in Europe surged to levels more than ten times the pre-crisis norm, and the competitiveness of European energy-intensive industry deteriorated sharply. Several large fertiliser plants shut down; aluminium smelters closed; chemical producers shifted production to regions with cheaper energy. The crisis raised serious questions about European deindustrialisation — the structural loss of energy-intensive manufacturing that cannot return even after gas prices normalise, because the global competitive landscape had shifted.
The Baltic Dry Index as a Leading Indicator
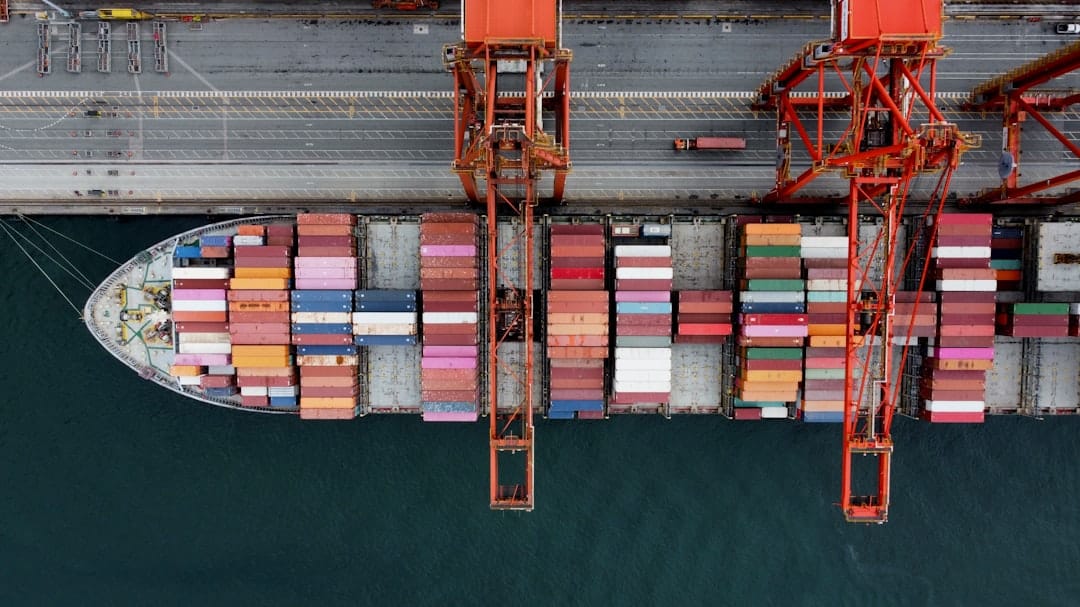
Photo by Daniel Miksha on Unsplash
The Baltic Dry Index (BDI) is published daily by the Baltic Exchange in London and measures the cost of shipping dry bulk commodities — primarily iron ore, coal, grain, and fertiliser — by sea. It covers three vessel categories (Capesize, Panamax, Supramax) and reflects freight rates across dozens of shipping routes globally.
The BDI is watched as a leading economic indicator because dry bulk shipping captures real physical trade flows. Ships carry actual commodities needed for real production — steel-making iron ore, power-generating coal, food-supplying grain. There is no financial speculation in shipping costs in the same way there can be in financial markets; rates reflect genuine supply and demand for cargo capacity.
Empirically, the BDI tends to lead global economic activity by roughly three to six months. When the global economy is accelerating, demand for raw materials rises, freight rates increase, and the BDI climbs. When growth is slowing, orders for raw materials fall, ships idle, and the BDI drops. The 2008 collapse in the BDI (from over 11,000 to under 700 in less than six months) signalled the severity of the global financial crisis before most economic data had confirmed it.