
What Correlation Means

Photo by ketan rajput on Unsplash
Correlation is a statistical measure of how closely the returns of two assets move together. It is expressed on a scale from -1 to +1. A correlation of +1 means two assets always move in the same direction by the same proportion. A correlation of -1 means they always move in exactly opposite directions. A correlation of 0 means their movements are entirely independent of each other.
For investors, correlation is not an abstract statistic — it is the key to understanding whether a portfolio is genuinely diversified. A portfolio of twenty assets that all move together in the same direction is not diversified at all. A portfolio of two assets with a correlation of -1 would theoretically offset each other's volatility entirely.
In practice, most real-world asset pairs have correlations somewhere between 0 and +0.6, meaning they generally move in the same broad direction over time (since most financial assets are ultimately driven by economic conditions) but not in lockstep.
The Markowitz Insight

Photo by Almas Salakhov on Unsplash
The key theoretical insight underlying Harry Markowitz's 1952 work was that combining assets with less-than-perfect positive correlation reduces total portfolio risk without necessarily sacrificing all the return of the individual components. If two assets each have high individual volatility but their returns are uncorrelated, the combined portfolio will be smoother than either asset alone.
This is why diversification can reduce risk without requiring you to hold only low-return assets. By holding assets that respond differently to economic conditions — equities rising in growth, bonds holding up in recession, commodities gaining during inflation — an investor benefits from the mathematical smoothing effect of low correlation.
The extent of this benefit depends entirely on the correlation coefficient. Markowitz's framework showed that the lower the correlation between assets, the greater the risk reduction achievable from combining them. A portfolio combining equities and government bonds historically exploited this: during equity bear markets, investors often fled to bonds, pushing bond prices up even as stocks fell.
Correlation in Crises: The Convergence Problem
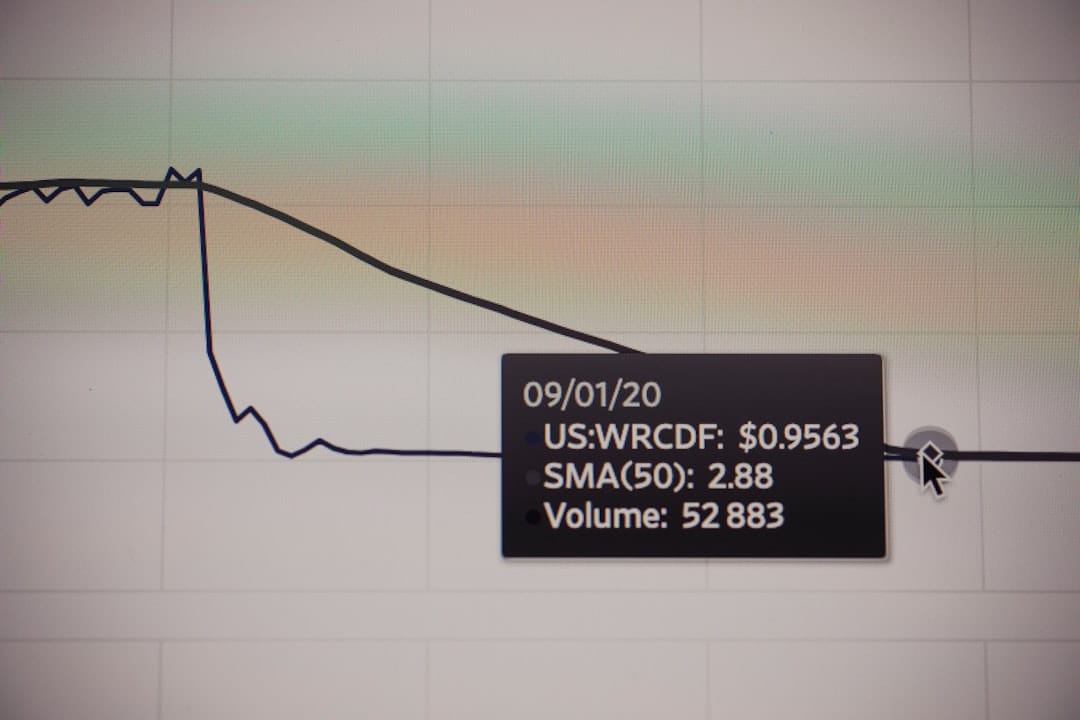
Photo by Markus Spiske on Unsplash
One of the most important and uncomfortable findings in empirical finance is that correlations are not stable. In normal markets, many asset classes display relatively low or moderate correlations. But during financial crises, correlations tend to spike sharply toward +1. This is sometimes described as assets "correlating up" in crashes.
Andrew Ang and Geert Bekaert, in research spanning the late 1990s and 2000s, documented this phenomenon extensively. They found that the correlation structure assumed from calm periods systematically underestimates the co-movement of assets during downturns — precisely when diversification is most needed. The assets that appeared uncorrelated in 2006 moved together dramatically in the 2008 financial crisis.
The mechanism is behavioural and structural: in a crisis, investors sell whatever they can — not just what is falling — to raise cash. Liquidity demands override fundamental considerations, creating forced co-selling across asset classes. As a result, historical correlation data measured during stable periods can give a false sense of protection.
The Limitations of Historical Correlation

Photo by Andrew Stutesman on Unsplash
Relying on historical correlation as a prediction of future behaviour has three significant limitations.
First, as Ang and Bekaert's work demonstrates, correlations change in crises — the historical average underestimates co-movement during the periods that matter most.
Second, structural changes in markets alter correlations over time. The relationship between stocks and bonds, for example, shifted notably in the post-2020 inflationary environment: both asset classes fell simultaneously, a pattern that had been rare for two decades under low-inflation conditions.
Third, sample period dependency means that correlation estimates are only as representative as the period they are drawn from. A 20-year sample that happened to include only low-inflation periods will produce different correlation estimates than one that includes the 1970s.
The practical conclusion is to use correlation analysis as a guide rather than a guarantee. Building a portfolio with low-correlation assets is still valuable — it reduces risk under most conditions — but it should not be treated as a permanent shield against synchronised losses.