
What Alpha Means

Photo by Nick Chong on Unsplash
In the CAPM framework, alpha is the return an investment earns above what its level of market risk (beta) would predict. If CAPM predicts a portfolio with a given beta should return 8% in a year, and the portfolio actually returns 11%, the alpha is +3 percentage points. Negative alpha means the manager destroyed value relative to what a passive, beta-matched portfolio would have earned.
Alpha is interpreted across the industry as evidence of skill — the ability to identify mispriced assets and earn returns that cannot be explained by market exposure alone. Active fund managers charge substantially higher fees than passive index funds on the premise that they can deliver positive alpha. In 2024, the global active fund management industry collected hundreds of billions of dollars in fees on this premise.
The formula used in practice comes from the Jensen alpha (Michael Jensen, 1968): alpha = actual portfolio return − [risk-free rate + beta × (market return − risk-free rate)]. A positive Jensen alpha means the manager beat the CAPM prediction; a negative one means they trailed it.
The Statistical Problem
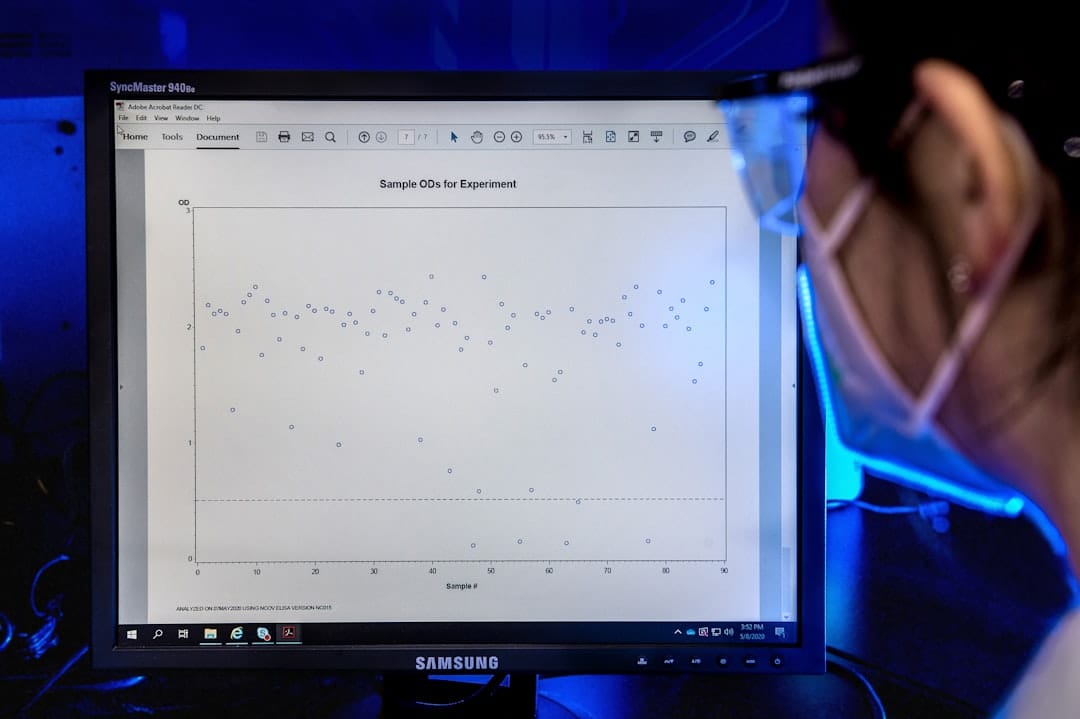
There is a deep and underappreciated statistical problem with detecting genuine alpha. Returns are noisy. Even a manager with true positive alpha of 2% per year will, in any given year, underperform or outperform by much more than 2% due to random variation. Separating signal from noise requires many years of data.
For a fund with annual return volatility of 15%, detecting a true alpha of 2% per year at conventional statistical significance (p < 0.05) requires roughly 55 years of data. Even a fund with a strong alpha of 4% per year would need around 14 years of data before that outperformance could be statistically distinguished from luck. Very few fund managers have track records long enough to make this determination.
This means that when you look at the distribution of fund returns at any point in time, you are largely looking at the distribution of luck, not skill. The few managers who appear at the top of performance tables may be genuinely skilled, or may simply have drawn lucky random outcomes.
The Evidence

Photo by Wesley Tingey on Unsplash
Mark Carhart's landmark 1997 paper in the Journal of Finance, "On Persistence in Mutual Fund Performance," studied US equity mutual fund returns over 31 years. After controlling for four systematic risk factors (market, size, value, and momentum), Carhart found almost no evidence of persistent positive alpha among fund managers beyond one year. The small persistence that existed in the short run was largely explained by momentum (good funds hold last year's winning stocks) and by the persistence of bad performance (consistently bad managers continue to underperform, partly due to high fees).
A large subsequent literature has confirmed this picture. The S&P SPIVA reports, published twice yearly, show that over ten-year periods, the majority of actively managed funds in most categories underperform their benchmark indices. The fraction that beat the index over ten years is consistent with what you would expect from chance alone, even before fees. After fees, the picture is bleaker still.
Fees and the Zero-Sum Game

Photo by Towfiqu barbhuiya on Unsplash
Before costs, alpha is a zero-sum game: every dollar of outperformance by one investor corresponds to a dollar of underperformance by another. After costs, the average active investor must underperform the average passive investor by exactly the amount of fees and transaction costs. This is arithmetic, not a hypothesis: William Sharpe laid it out in his 1991 paper "The Arithmetic of Active Management."
The uncomfortable conclusion: genuine alpha exists but is rare, difficult to identify in advance, and largely consumed by the fees charged to access it. For most investors, attempting to identify skilled active managers is a negative expected value activity.