
Two Ways to Measure Average Returns

Photo by Aaron Lefler on Unsplash
There are two common ways to calculate the average return of an investment over multiple periods. They produce different numbers, and the difference matters enormously for long-term investors.
The arithmetic mean is the simple average: add up all the annual returns and divide by the number of years. If a fund returns +30% in year one and -10% in year two, the arithmetic mean is (+30% + -10%) / 2 = 10%.
The geometric mean accounts for compounding. It asks: what constant annual return, compounded over the same period, would produce the same final result? For the same fund: £100 grows to £130 after year one, then falls to £117 after year two. The geometric mean is the return that gets you from £100 to £117 over two years — approximately 8.2% per year, not 10%.
Why the Arithmetic Mean Overstates What You Actually Earn
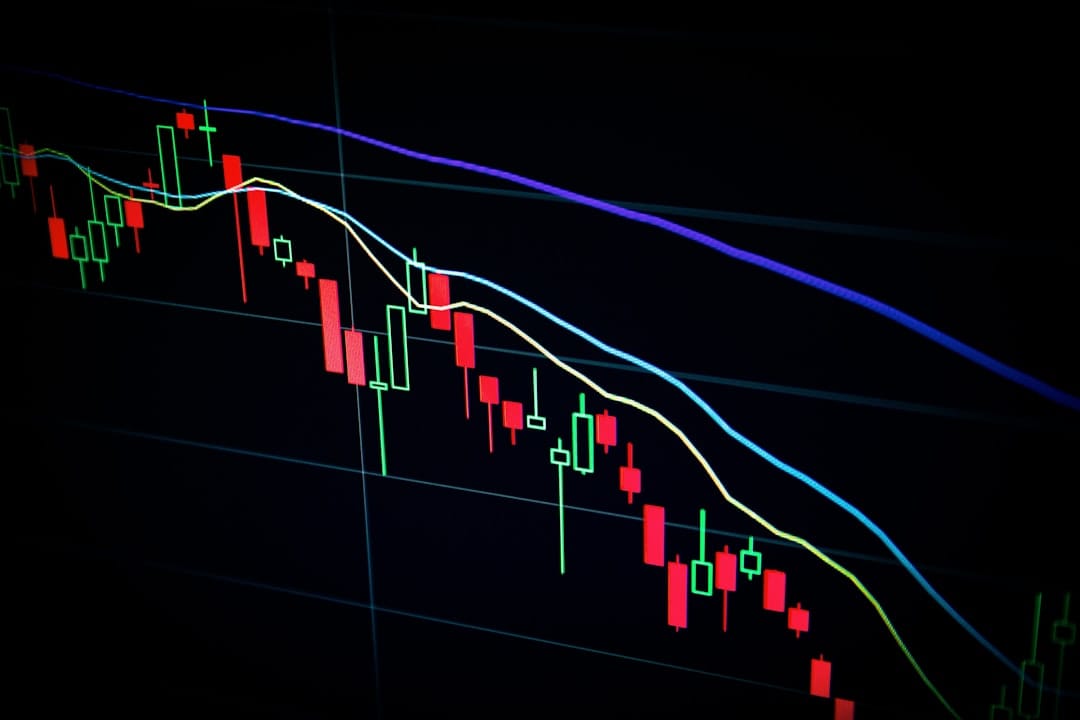
Photo by Maxim Hopman on Unsplash
The arithmetic mean can be deeply misleading as a guide to investor experience. Consider an extreme example: a fund that returns +50% in year one and -50% in year two. The arithmetic mean is 0%. But an investor who starts with £1,000 ends with £750. They have lost 25% of their capital despite a "zero" average return.
This gap — between the arithmetic mean and the geometric mean — is not a quirk of extreme examples. It occurs whenever there is any variability in returns, and it grows with volatility. The geometric mean will always be less than or equal to the arithmetic mean; they are equal only when returns are identical every period.
The relationship between the two is approximately: geometric mean ≈ arithmetic mean − (variance / 2). Variance is the square of standard deviation, so a fund with 20% annual volatility loses roughly 2% per year to this effect compared to its arithmetic mean. This is known as volatility drag, or variance drain.
Volatility Drag: The Hidden Cost of Volatility
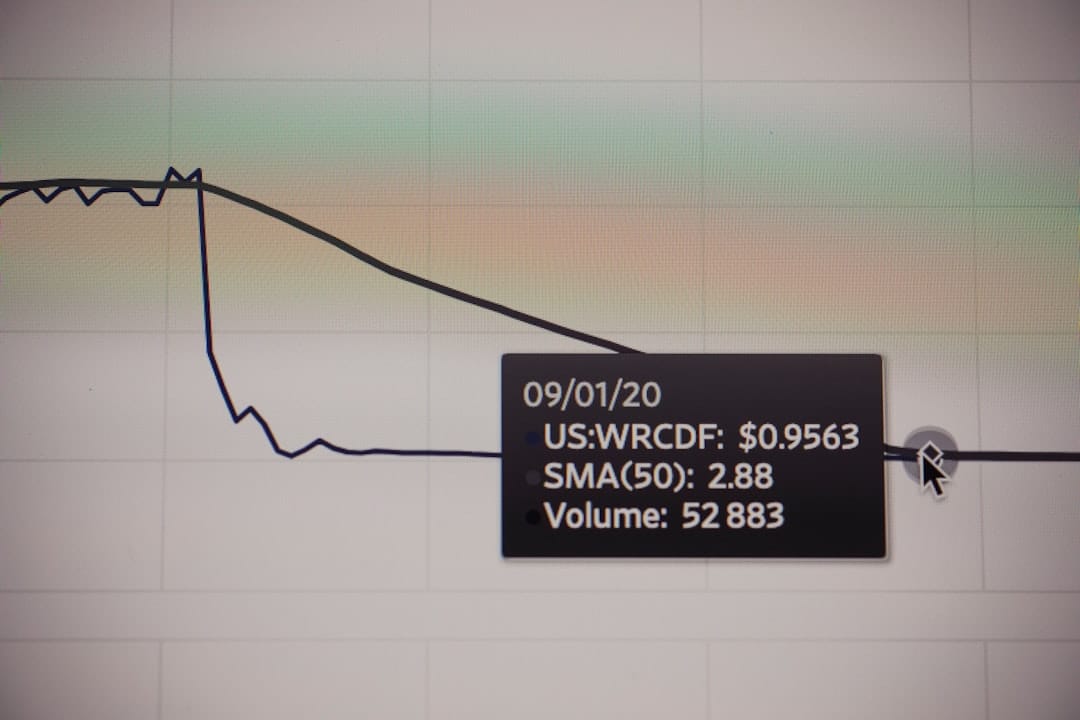
Photo by Markus Spiske on Unsplash
Volatility drag is why two funds with the same arithmetic mean return can produce very different long-run wealth outcomes if one is more volatile. William Sharpe noted in his landmark 1966 paper on mutual fund performance that comparing funds purely on the basis of average return, without adjusting for risk, was economically misleading for exactly this reason.
Suppose Fund A has an arithmetic mean return of 12% with 25% volatility. Fund B has an arithmetic mean return of 10% with 5% volatility. Fund A's geometric mean is approximately 12% − (0.25² / 2) = 12% − 3.1% = 8.9%. Fund B's geometric mean is approximately 10% − (0.05² / 2) = 10% − 0.1% = 9.9%. Fund B, despite a lower headline return, compounds to greater wealth over time.
Which Mean to Use

Photo by Douglas Lopez on Unsplash
When evaluating what a long-term investor actually earned or will earn, always use the geometric mean. When estimating the expected return of a single future period, the arithmetic mean is the correct input — it reflects the true probability-weighted average of possible outcomes. The confusion arises when arithmetic means from historical data are used to project long-run compound growth, which significantly overstates likely outcomes.