
Reading Price Through Indicators
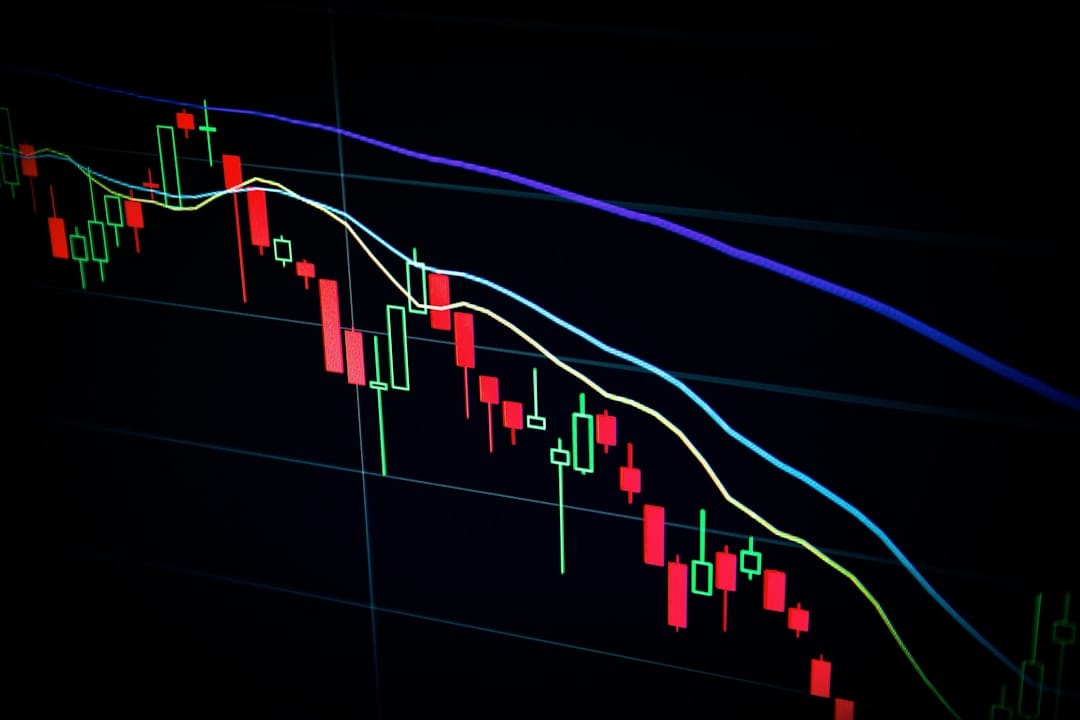
Photo by Maxim Hopman on Unsplash
Technical indicators are mathematical calculations applied to price and volume data to help investors identify trends, momentum, and potential turning points. They are tools, not oracles. The academic evidence for any single indicator generating consistent excess returns on its own is weak — but indicators are widely used in practice as discipline tools: structuring decision-making, managing entry and exit timing, and providing a systematic framework for reading market conditions rather than reacting emotionally.
Understanding the most common indicators — their construction, their interpretation, and their limitations — is useful both for evaluating financial content you encounter and for making more deliberate decisions about when and how to act on a market view.
Moving Averages: The Foundation
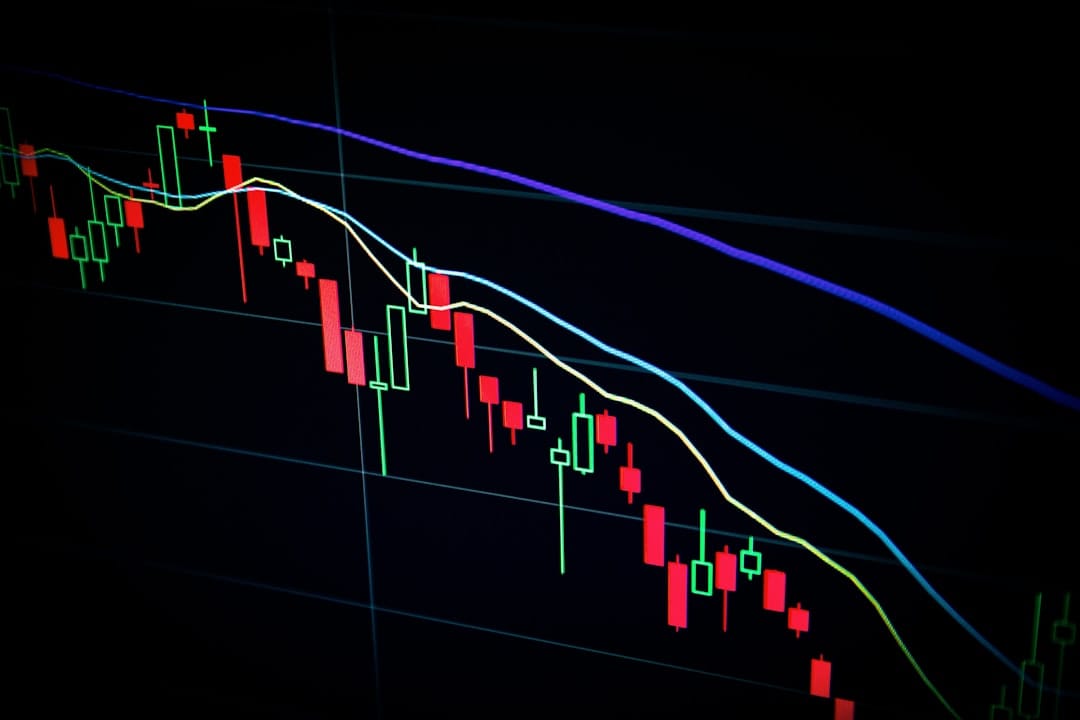
Photo by Maxim Hopman on Unsplash
The simple moving average (SMA) is the arithmetic mean of a security's closing price over a defined number of periods. A 50-day SMA averages the last 50 closing prices. A 200-day SMA averages the last 200. Moving averages smooth out short-term noise, making the underlying trend easier to see.
The exponential moving average (EMA) is a variation that gives greater weight to more recent prices, making it more responsive to new information. Because markets move quickly, many traders prefer EMAs for shorter-term analysis.
A widely used signal is the crossover: when a shorter-period moving average crosses above a longer-period one (a "golden cross" — for example, the 50-day crossing above the 200-day), it is interpreted as a bullish trend signal. The reverse (a "death cross") is bearish. These terms are colourful, but their predictive reliability in academic studies is inconsistent.
RSI: Measuring Momentum
Photo by Maxim Hopman on Unsplash
The Relative Strength Index (RSI) was developed by J. Welles Wilder, introduced in his 1978 book New Concepts in Technical Trading Systems. RSI measures the speed and magnitude of recent price changes on a scale from 0 to 100. A reading above 70 is conventionally interpreted as overbought — the asset may have risen too far, too fast. A reading below 30 suggests oversold conditions.
RSI is a momentum oscillator: it does not predict direction, but it flags when momentum has become extreme in one direction. Wilder recommended a 14-period RSI as the default, which remains the most widely used setting. As with all indicators, RSI generates false signals in strongly trending markets — an asset can remain overbought for a long time in a powerful uptrend.
MACD: Trend and Momentum Combined
The Moving Average Convergence Divergence (MACD) indicator was created by Gerald Appel in the late 1970s. It is constructed by subtracting a 26-period EMA from a 12-period EMA, producing a line that oscillates above and below zero. A 9-period EMA of the MACD line — the "signal line" — is then plotted alongside it.
Traders look for two main signals: when the MACD line crosses above the signal line (bullish); when it crosses below (bearish). They also watch for divergence between the MACD and the price: if price makes a new high but MACD does not confirm it, this may suggest weakening momentum. MACD combines trend and momentum information in a single indicator, which is why it remains one of the most popular in technical analysis.
Bollinger Bands
Photo by Anne Nygård on Unsplash
Bollinger Bands were developed by John Bollinger in the early 1980s and introduced in Bollinger on Bollinger Bands (2001). They consist of three lines: a middle band (typically a 20-day SMA) and two outer bands set at two standard deviations above and below the middle band. The bands widen during volatile periods and narrow during quiet ones.
Price touching the upper band is sometimes interpreted as overbought; touching the lower band as oversold. More precisely, Bollinger designed the bands to define a range within which price tends to be contained — roughly 95% of price action falls within two standard deviations. The squeeze — when the bands narrow dramatically — is watched as a signal that a significant breakout may be building.
The Caveat: Indicators as Discipline, Not Prediction
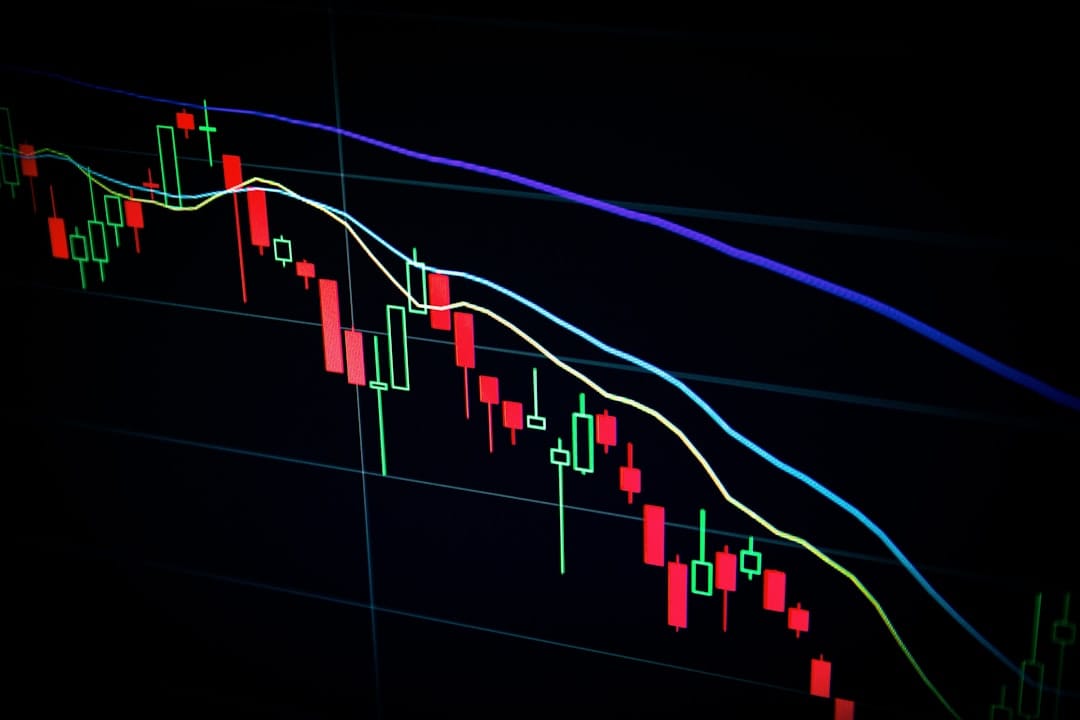
Photo by Maxim Hopman on Unsplash
The critical limitation of technical indicators is well established in academic finance. Research consistently finds that no single indicator or combination of indicators generates statistically significant excess returns on a standalone basis after accounting for transaction costs and data-mining biases.
What indicators can do is impose discipline: providing structured criteria for entries, exits, and risk management that prevent purely emotional decision-making. A trader who only buys when RSI is below 40 and sells when it exceeds 70 is following a rule — and rules, even imperfect ones, tend to produce more consistent outcomes than impulse-driven decisions. This is the most defensible use of technical tools for most investors.